Stop starting every Excel report from scratch
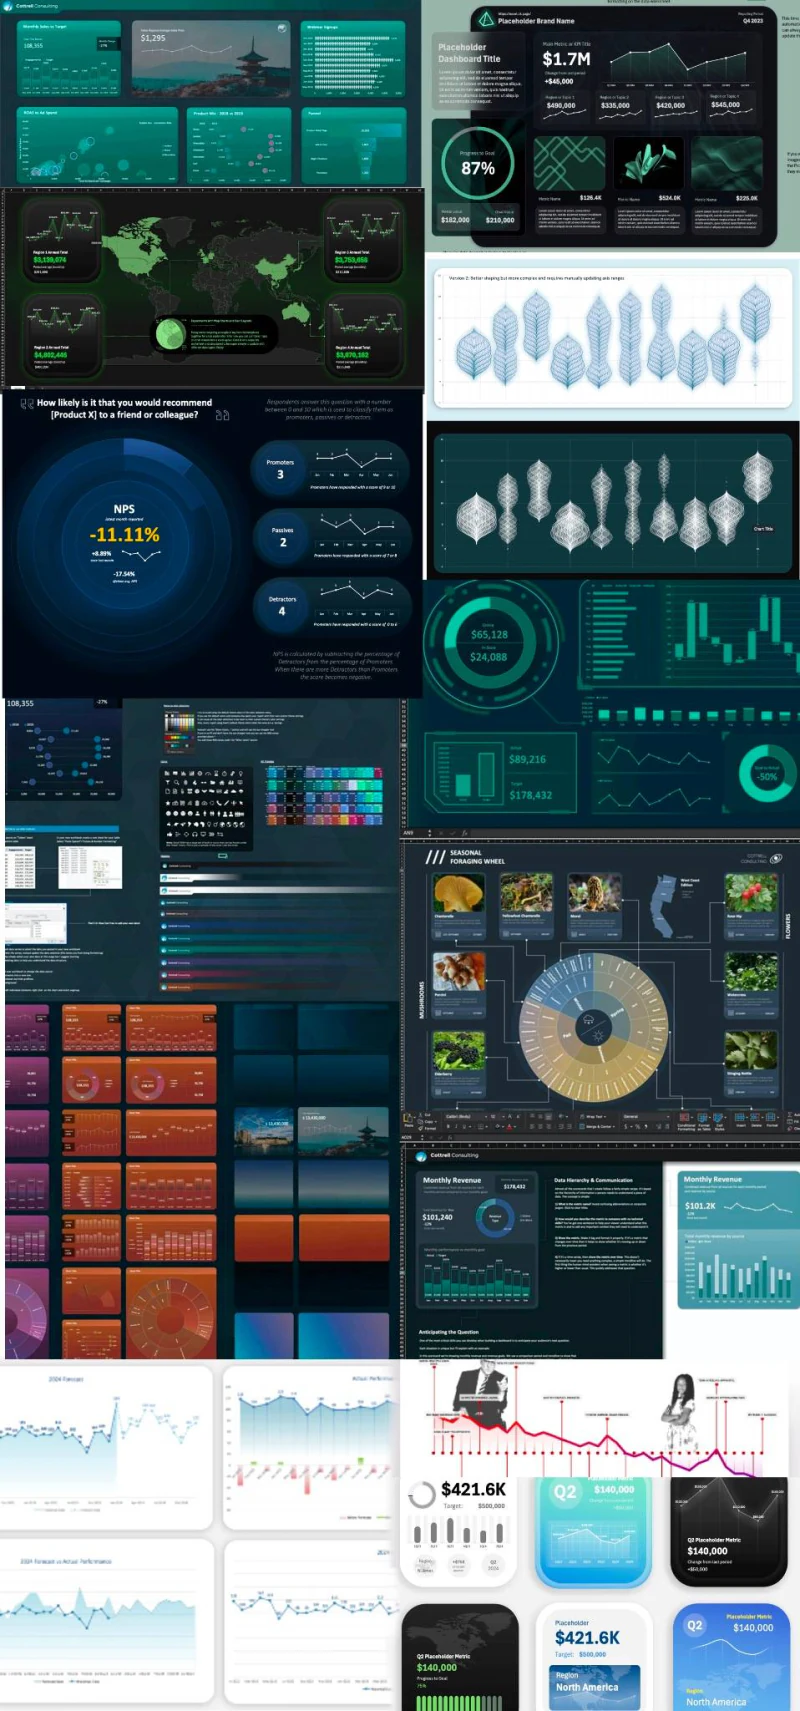
This gives you hundreds of Excel charts, dashboard layouts, style libraries, and reusable design elements across the Big Excel Energy workbook archive and the 13-sheet Dashboard Toolkit. You can open the files, see how the work was built, and adapt the useful parts instead of starting from a blank workbook.
Newsletter templates
Dashboards, charts, filters, visual experiments, reporting samples, and reusable techniques from the newsletter archive.
Dashboard Toolkit
Five style-and-chart libraries, three sample dashboards, instructions, source tables, sample data, and other page elements.
Working + reference files
Some files are connected reports. Others isolate a chart, layout, or visual idea so it is easier to understand and reuse.
Why I made the Toolkit
I made these files to test the boundaries of visual design in Excel. The useful part is not just the finished screenshot; it is being able to open the workbook and see how the layers, spacing, chart choices, data, and formatting create the result.
You do not have to reproduce an entire dashboard. Sometimes the thing worth borrowing is one KPI treatment, one layout, one slicer style, or the way a chart handles context.
Three ways to use it
- Find a dashboard, chart, or visual treatment close to what you need.
- Open the file and follow how its data, visuals, and layout work together.
- Adapt the useful parts to your own data, structure, and brand.
You do not need to copy an entire dashboard. A layout pattern, chart treatment, slicer style, or formatting system can be the useful part. The goal is to give you better starting material and show you how it was made.
When you adapt an example, borrow the structure before the decoration: decide what deserves attention, what needs comparison, and what action the report should support. Then use color, typography, and visual effects to reinforce that hierarchy instead of competing with it.
Is this the right one?
Best fit
You build recurring Excel reports and want a deep shelf of examples and reusable ideas you can inspect, remix, and make your own.
Probably not the best fit
You want one universal dashboard that accepts any data automatically, or you mainly want rules for a shared theme. For the latter, choose the Theme Guide.
Excel compatibility
Designed for Microsoft Excel on Windows and Mac — Microsoft 365 or Excel 2021 recommended. Built for Excel, not Google Sheets.