Make your reports read like a finished document.
Board decks and financial statements. The monthly and quarterly packs your team rebuilds every period. Excel report design turns them from raw spreadsheets into documents people actually read.
Joshua Cottrell-Schloemer · 3× Microsoft Excel MVP · helped brands like Microsoft, Kellogg's, Philips, Novo Nordisk
Excel report design is the practice of applying design (layout, typography, hierarchy, color, chart design) to recurring reports like board decks and monthly or quarterly financial packs, so they read like a finished, designed document instead of a raw spreadsheet. Because these reports run on a schedule, the highest-value version is a reusable report system that looks consistent every period and updates in one place.
What report design covers
A report isn't a single screen, it's a sequence. A board pack or monthly financial report is read top to bottom, page after page, often by people who didn't build it and won't ask questions. Report design is what makes that sequence legible: a clear structure, a consistent grid across pages, summary numbers that lead, and detail that supports the story instead of burying it.
In practice it covers everything from the cover and contents, through the executive summary, the KPI and headline figures, down to the supporting tables and charts, plus the through-line that ties one period to the next. The same Excel design principles apply (hierarchy, restrained color, deliberate typography, honest charts) but pointed at a multi-page, recurring document rather than one interactive screen.
I've seen millions of dollars spent on incredible analysis that never got used because someone didn't consider how to communicate with their audience. A report that's hard to read is a report nobody acts on. Fixing that is the entire reason report design exists.
The answer, the evidence, and the rules behind the system.
Report design is not a prettier table. It's deciding what leads and what supports it, plus how every page stays consistent the next time the report is rebuilt.
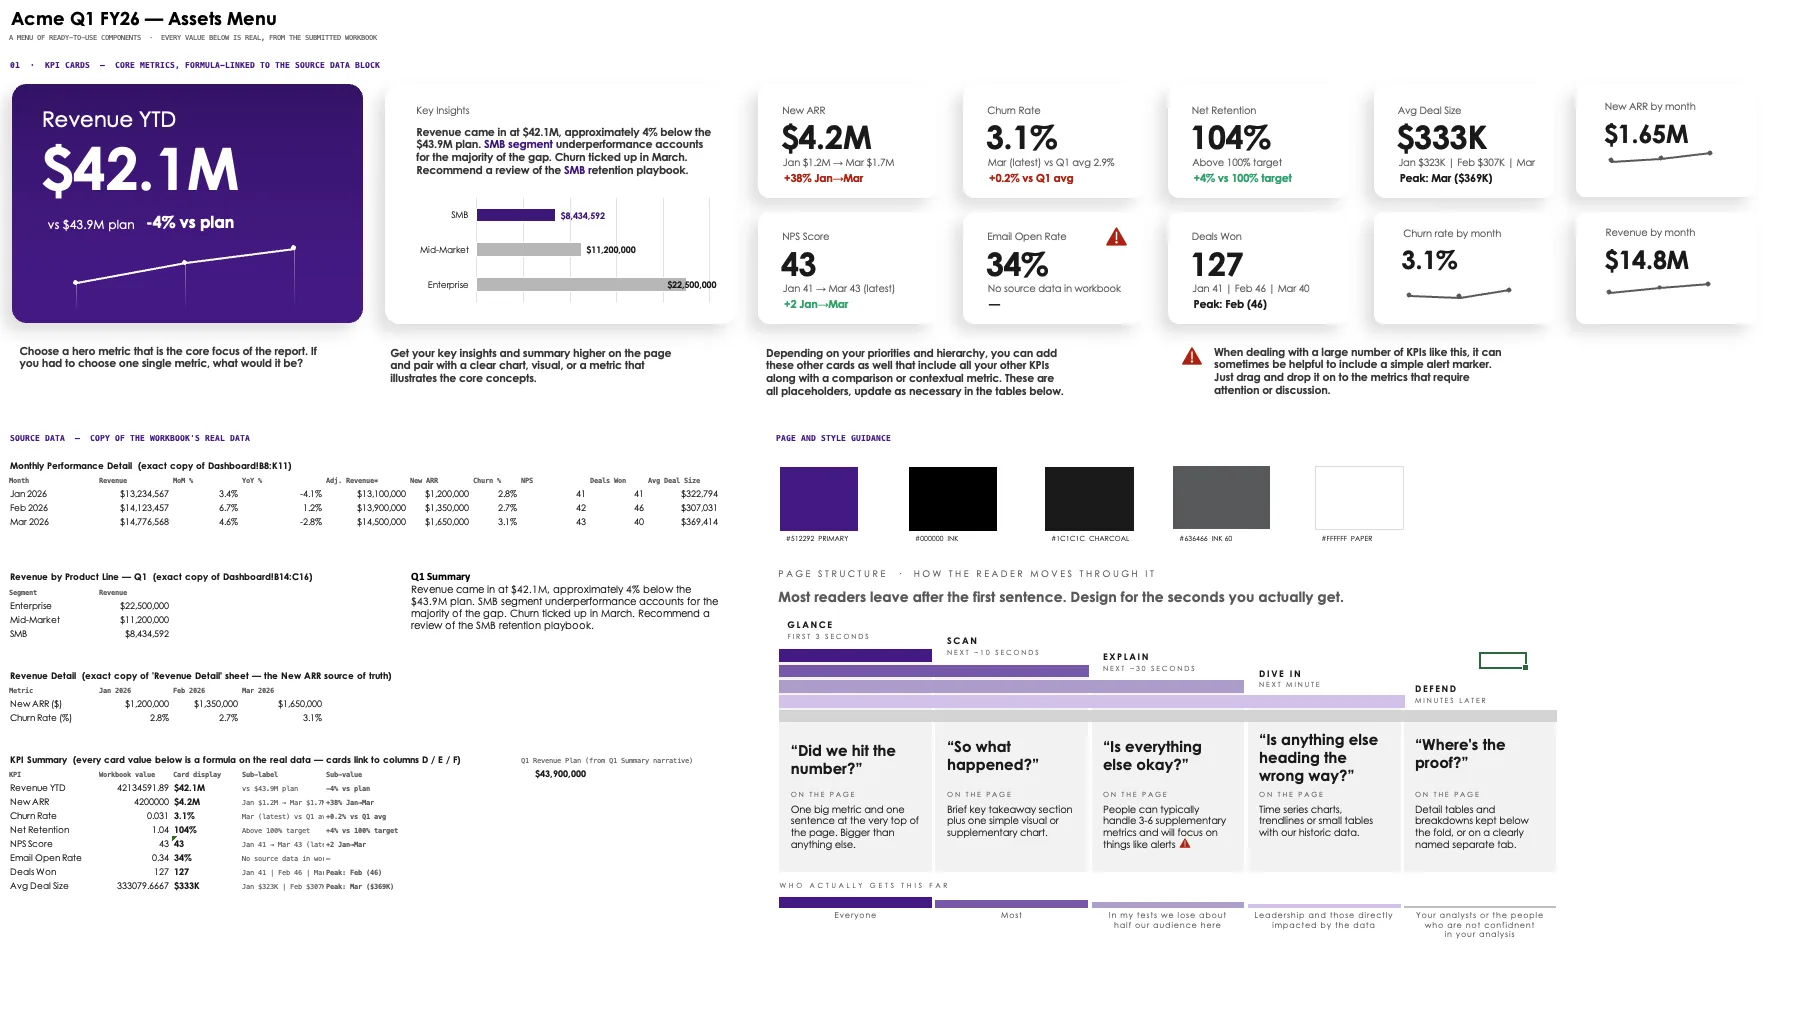
What good report design does
One structure, every period
A repeatable layout and contents order so each month's report feels like the same document - comparable at a glance and faster to build.
Summary leads, detail supports
The headline figures and the story come first. The supporting tables sit behind them. Readers get the answer before the evidence.
A consistent grid
Aligned columns, shared margins, predictable spacing across every page. The quiet thing that makes a pack feel professionally produced.
Restrained, meaningful color
One accent used as a signal, neutral everywhere else. Variance and direction are coded consistently, not decorated.
Honest, comparable charts
The chart that shows the comparison fastest, styled the same way every period so trends read instantly across reports.
A reusable system
A set theme of colors and fonts plus spacing rules, so the whole reporting suite stays consistent and updates from one place.

Options & pricing
Most recurring reports need a proper design engagement. Report Design Direction is for the narrower case where the report is already built and you will make the changes yourself.
Bespoke report system
A designed, reusable Excel reporting system for your recurring board packs and monthly or quarterly financial reporting, built from the ground up to your brand and your data. Scoped as a consulting engagement, and projects typically start at $5,000.
Use the short project form →Report Design Direction
For an already-built recurring report whose owner will make the edits. You get a recorded teardown and a clear priority plan, with direction for the part that is not landing. Not a rebuild.
See if your report fits →Brand + Setup add-on
Already chose a compatible Big Excel Energy template? I can apply your brand and a short, named list of light changes. This is a template add-on, not a report-design engagement.
See if your template fits →From principle to file
Dashboard & report examples
A gallery of polished Excel work with the design ideas behind each one.
See examples →What is Excel design?
The principles behind every designed report, defined in plain English.
Read the definition →Dashboard Toolkit + workbook library
Start from finished reports, source tables, chart styles, reusable report elements.
See the working files →Dashboard redesign
Have an existing dashboard? Get it redesigned to the same standard.
See redesign →The receipts
Beyond client work, I've got 485,000+ followers on TikTok and 19,000+ newsletter subscribers, and nearly a million of my free Excel files are floating around out there. More about me →
Report design, answered
What is Excel report design?
Excel report design is the practice of applying design (layout, typography, hierarchy, color, chart design) to recurring reports like board decks and monthly or quarterly financial packs, so they read like a finished, designed document rather than a raw spreadsheet. The goal is a report that explains itself and gets read.
What kinds of reports does this cover?
Recurring, repeatable reports: monthly and quarterly reporting packs, board reports, financial statements, KPI summaries, management reports. Because these run on a schedule, the biggest payoff is a reusable system: design it once and every period after that comes out consistent.
How do I get my reports designed?
A bespoke, reusable report system is scoped as a consulting engagement with project minimums typically starting at $5,000. If the report is already built and recurs on a schedule, and you'll implement the advice yourself, see whether Report Design Direction fits.
How is report design different from dashboard design?
They share the same principles. A dashboard is usually a single interactive screen. A report is a multi-page, often recurring document (a board pack or a monthly financial report) that needs to read in sequence like a finished document, with consistent structure across pages and periods. See dashboard redesign →
How do we get started?
For a bespoke report system, use the short project form with a description of your reports and what you need them to do. If your report is already built and you'll be making the changes yourself, Report Design Direction is probably the better starting point.