What is a 9-box grid?
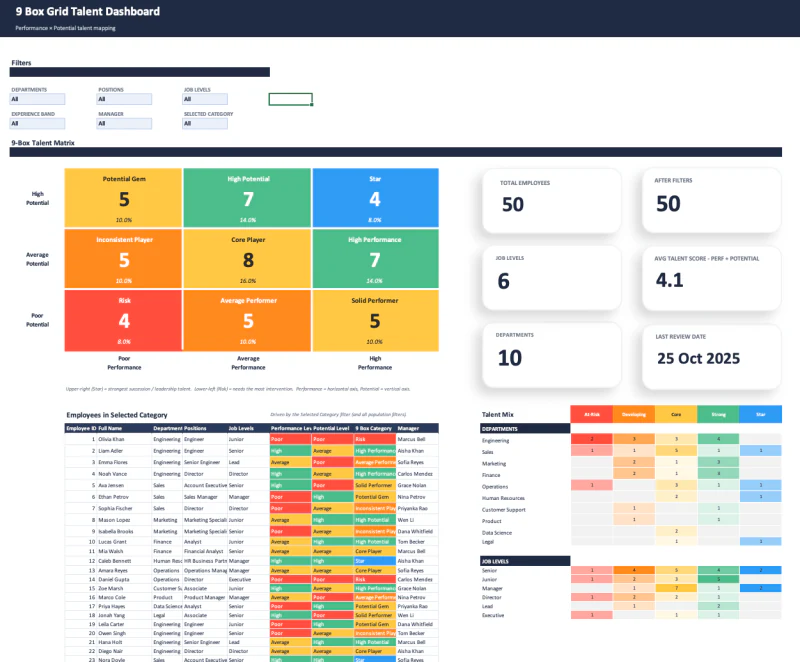
A 9-box grid is a 3×3 talent-management matrix that plots employees by performance and potential to guide succession planning. This Excel template runs that McKinsey-style analysis automatically.
New to the model? Read the complete guide to the 9-box grid in Excel first. It explains the nine categories, how to build the matrix yourself, why the scoring rubric matters more than the colors, and the mistakes that make a talent review unreliable. For related tools, browse the HR and People Operations template collection.
What's included
- A McKinsey-style 9-box analysis from simple 1–3 scores
- Auto-generated insights and dashboard visuals
- Filters and structured output tables
- A clean data-entry sheet for your team
How it works
Enter your team and score each person 1–3 on performance and potential. The template generates the grid, dashboard-style visuals, filters, and structured tables you can pull into other tools.
What you enter and what the workbook returns
Start with one row per employee. Alongside the person’s name, you can organize the review by details such as department, position, job level, years of experience, manager, and review date. The workbook can group those years into an experience band; the two inputs that drive the grid are the performance and potential scores, each entered on a simple 1–3 scale.
Those scores feed the nine categories automatically. The dashboard then gives you the matrix counts and percentages, a filterable employee table, headline metrics, and talent-mix summaries by department and job level. Select a category or population filter to see the individual employees behind the summary rather than stopping at the colored grid.
A decision aid, not an automatic talent verdict
Excel can map the scores consistently. It cannot decide whether the scores are fair, comparable, or useful. Define what a 1, 2, and 3 mean before the review, use a clear review period, and calibrate across managers so one person’s “high” means roughly the same thing as another’s.
The strongest use of a 9-box grid is to structure a conversation and attach an action to each placement—coaching, a stretch assignment, retention planning, a role change, or a candid performance conversation. It should not be treated as a stack ranking or used as the only input to a high-stakes people decision.
Who it's for
HR teams, managers, and leaders running talent reviews and succession planning.
Excel compatibility
Requires Excel 2021 or Microsoft 365 (Windows or Mac). It uses newer dynamic-array features, so it will not work in Excel 2019 or earlier.